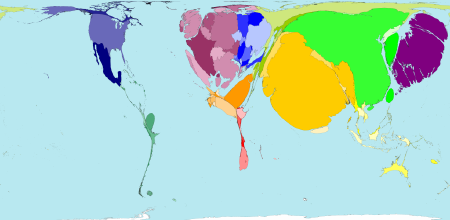
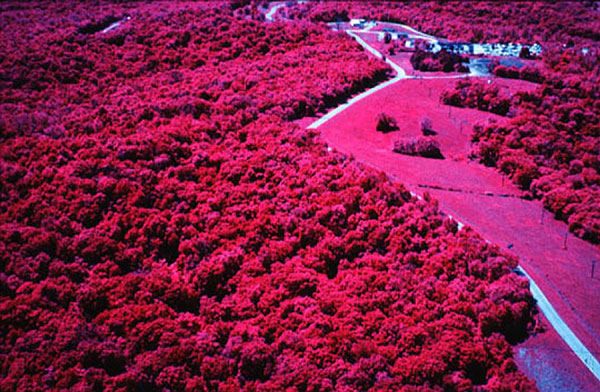
A type of thematic map that uses line symbolys to show a continuous distribution such as elvation. In this map dew point is shown, the red area is the most saturated area.
Flow maps show the movement or migration of objects or people from location to another. Flow maps (aka flow charts) are often used in the workplace to show an organized way of reaching an objective or to show a simplified way of how an output is reached.
Statistical maps are based upon numerical values. The example map depicts statistical changes in burglaries in the Denver, Colorado, area. The yellow areas indicate a decrease in crime from 2001 to 2002; the orange areas show an increase; and the white areas stayed the same. If you look closely the percentage change is also on the map. Overall there has been in increase of crime.