
Friday, April 23, 2010
Isopleths
Isopleth maps are contour maps, they typically display variables such as temperature, precipitation, pressure, etc. In this example pH values across the United States are shown. The legend shows that various colors represent different pH scores.


DRG

DRGs, Digital Raster Graphics, are scanned from topographic maps. DRGs are often used as overlays for other types of GIS maps.
DLG

Digital Line Graphs, DLG for short, clearly show roads, rivers, lakes, etc. This DLG is from Athens, Georgia.
DOQQ
DOQQ, or Digital orthophoto quarter quadrangle, are often used to regulate industries. In this particular example is used for flood preparation and insurance agencies. 
http://www.crwr.utexas.edu/gis/gishydro00/Class/trmproj/Donnelly/termproject.htm
Continuously variable proportional circle map
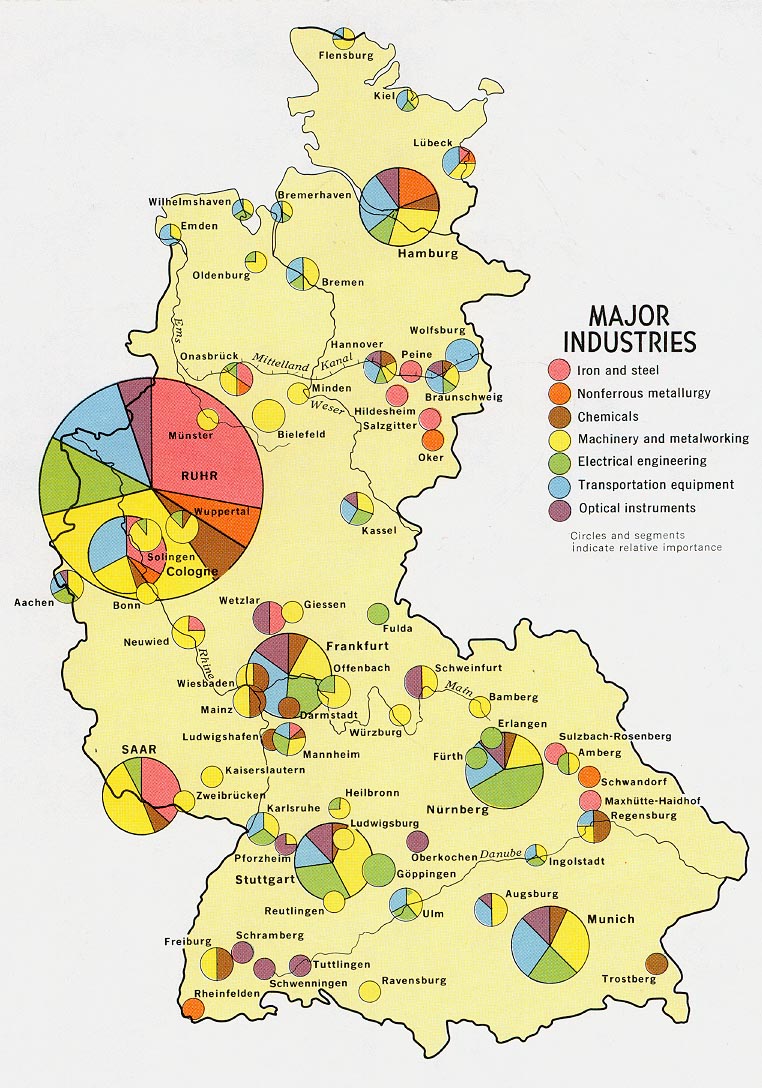
Continuously variable proportional circle maps are a type of proportional cirlcle maps which use circles to create point data. The circles will always be in proportion to the variable being measured.
http://www.lib.utexas.edu/maps/europe/west_germany_ind_1972.jpg
Range graded proportional circle map

Range graded proportional circle maps use proportional circles to show the relationship of a variable between two areas. This map uses larger circles for larger population.
Classed choropleth maps
This Classed choropleth maps is from census bureau map which displays classes of varying percentages that also represents the percentage of the population which is hispanic or latino in each county (the areal unit) within the state of Florida.![[classed+choropleth+map.gif]](https://blogger.googleusercontent.com/img/b/R29vZ2xl/AVvXsEjbyF1HX0ut4ZoKrYY-663N5USUVR6VfEmiDenLIKV5ruv2iU071dNQIgYs0zkHLNnr18sfpJ99dwogIc07QjuT-fZpyFet2xd9eLwMI9CDpip5lqXtvuFB-kvPsmn81KuVzrLDbsFFBeI/s1600/classed+choropleth+map.gif)

Subscribe to:
Posts (Atom)