Friday, April 23, 2010
Topographic map
Topographic maps show the topography of the land. They are used to illustrate the physical features of the mapped area. This is an example of a topographic map of Brazil, it shows rivers, mountains, highlands, lowlands, deserts, etc..


Thematic maps
Thematic maps are typically used to show a theme associated with a particular geographic area. This map is of Hawaii and breaks down the land to show ownership and function.
Cadastral maps
Cadastral maps are used for exhibiting boundaries and ownership. This is from Delaware, Ohio and all the sections are color coordinated to show boundaries.
PLSS maps
These maps are created from the public land survey system and divides an area into ownership. This map is for Ohio.
Hypsometric maps
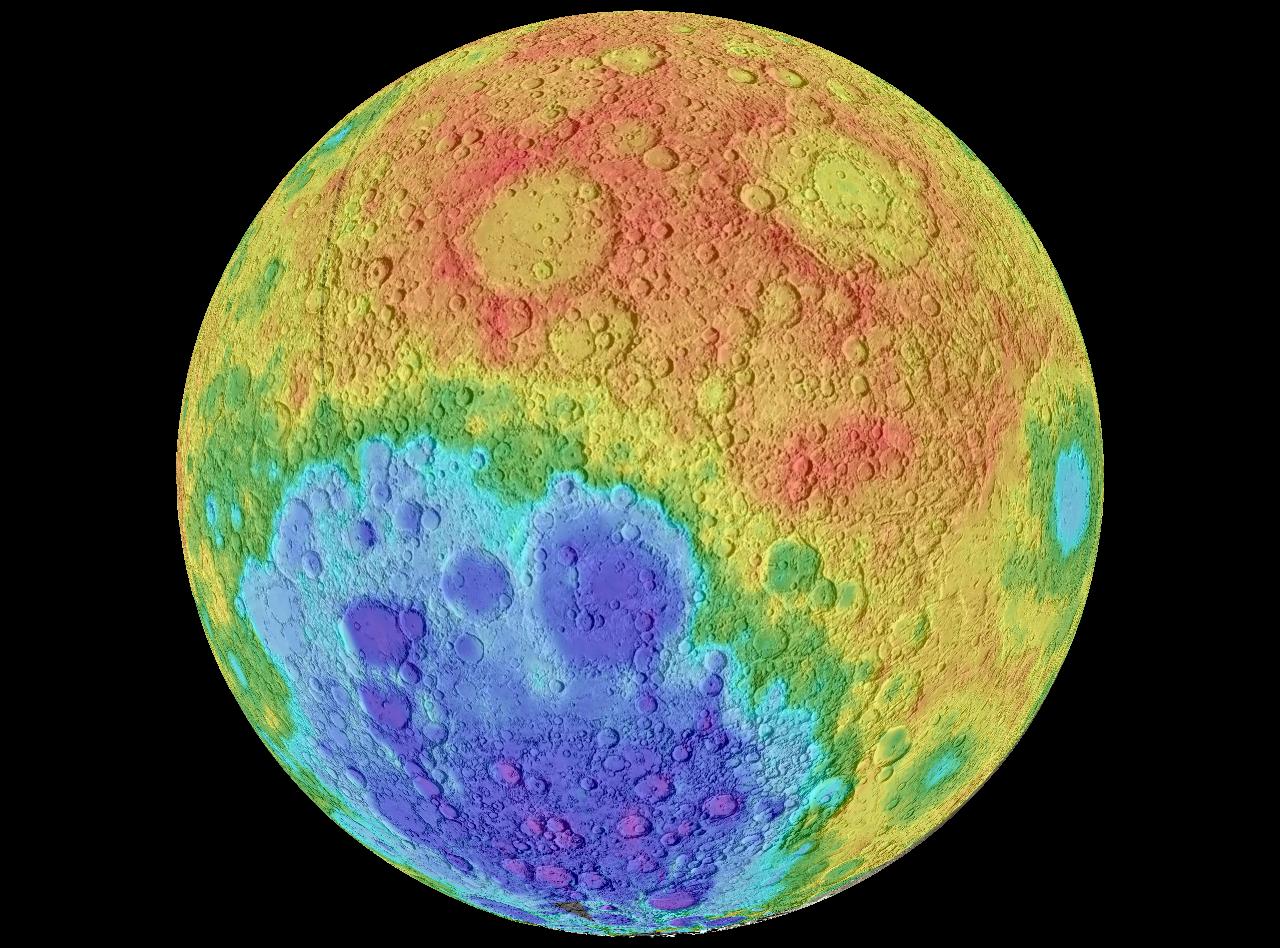
Through the use of shading and tinting, hypsometric maps show elevation. This example is of the moon.
Propaganda maps
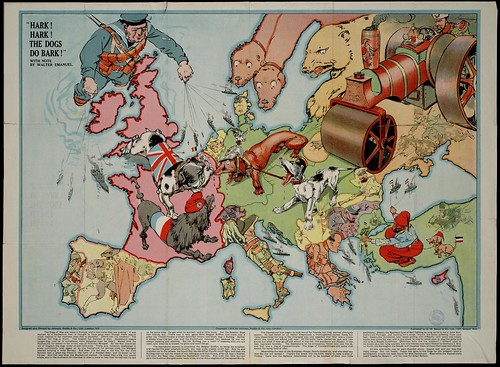
Propaganda maps are used to promote a state or any similar entity. This example is showing English and Russian "superiority".
Dot distribution maps

On this mao historically active volcanoes are represented with dots. The distribution of dots shows that volcanoes are normally found on the meeting edges of tectonic plates.
Proportional circle maps

http://instruct.uwo.ca/geog/242/fig22.gif
Areas of the shown circles are proportional to the amount of data contained inside the circle, for example population.
Isoline maps
A type of thematic map that uses line symbolys to show a continuous distribution such as elvation. In this map dew point is shown, the red area is the most saturated area.
http://images.google.com/
Flow maps
Flow maps show the movement or migration of objects or people from location to another. Flow maps (aka flow charts) are often used in the workplace to show an organized way of reaching an objective or to show a simplified way of how an output is reached.

Cartograms
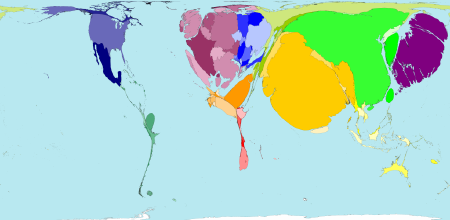
Cartograms are representations of maps of focused by weight or highlights according to the sort of data you’re interested in studying.
Statistical maps

Statistical maps are based upon numerical values. The example map depicts statistical changes in burglaries in the Denver, Colorado, area. The yellow areas indicate a decrease in crime from 2001 to 2002; the orange areas show an increase; and the white areas stayed the same. If you look closely the percentage change is also on the map. Overall there has been in increase of crime.

Cartographic animations

Cartographic animations are used to show visual changes on a map, such as the movement of a hurricane.
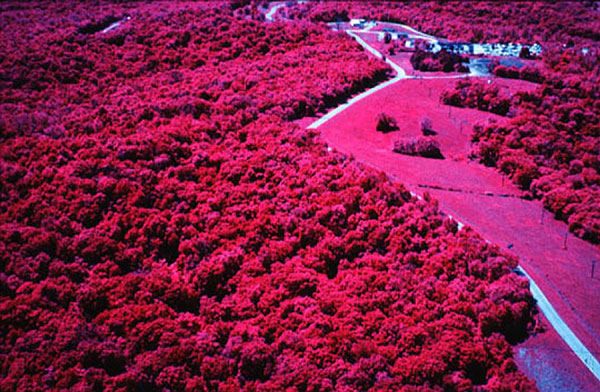
Black and white aerial photo

http://isaacalongi.com/wp-content/uploads/2008/11/black_and_white_aerial_photograph_of_kc.jpg
THis is a black and white aerial photo of the American Interstate system.
Doppler radar
 http://www.weatherusa.net/blog/images/doppler-orlando-1943.gif
Doppler Radar is used to map weather. This map shows precipitation over south Florida.
LIDAR
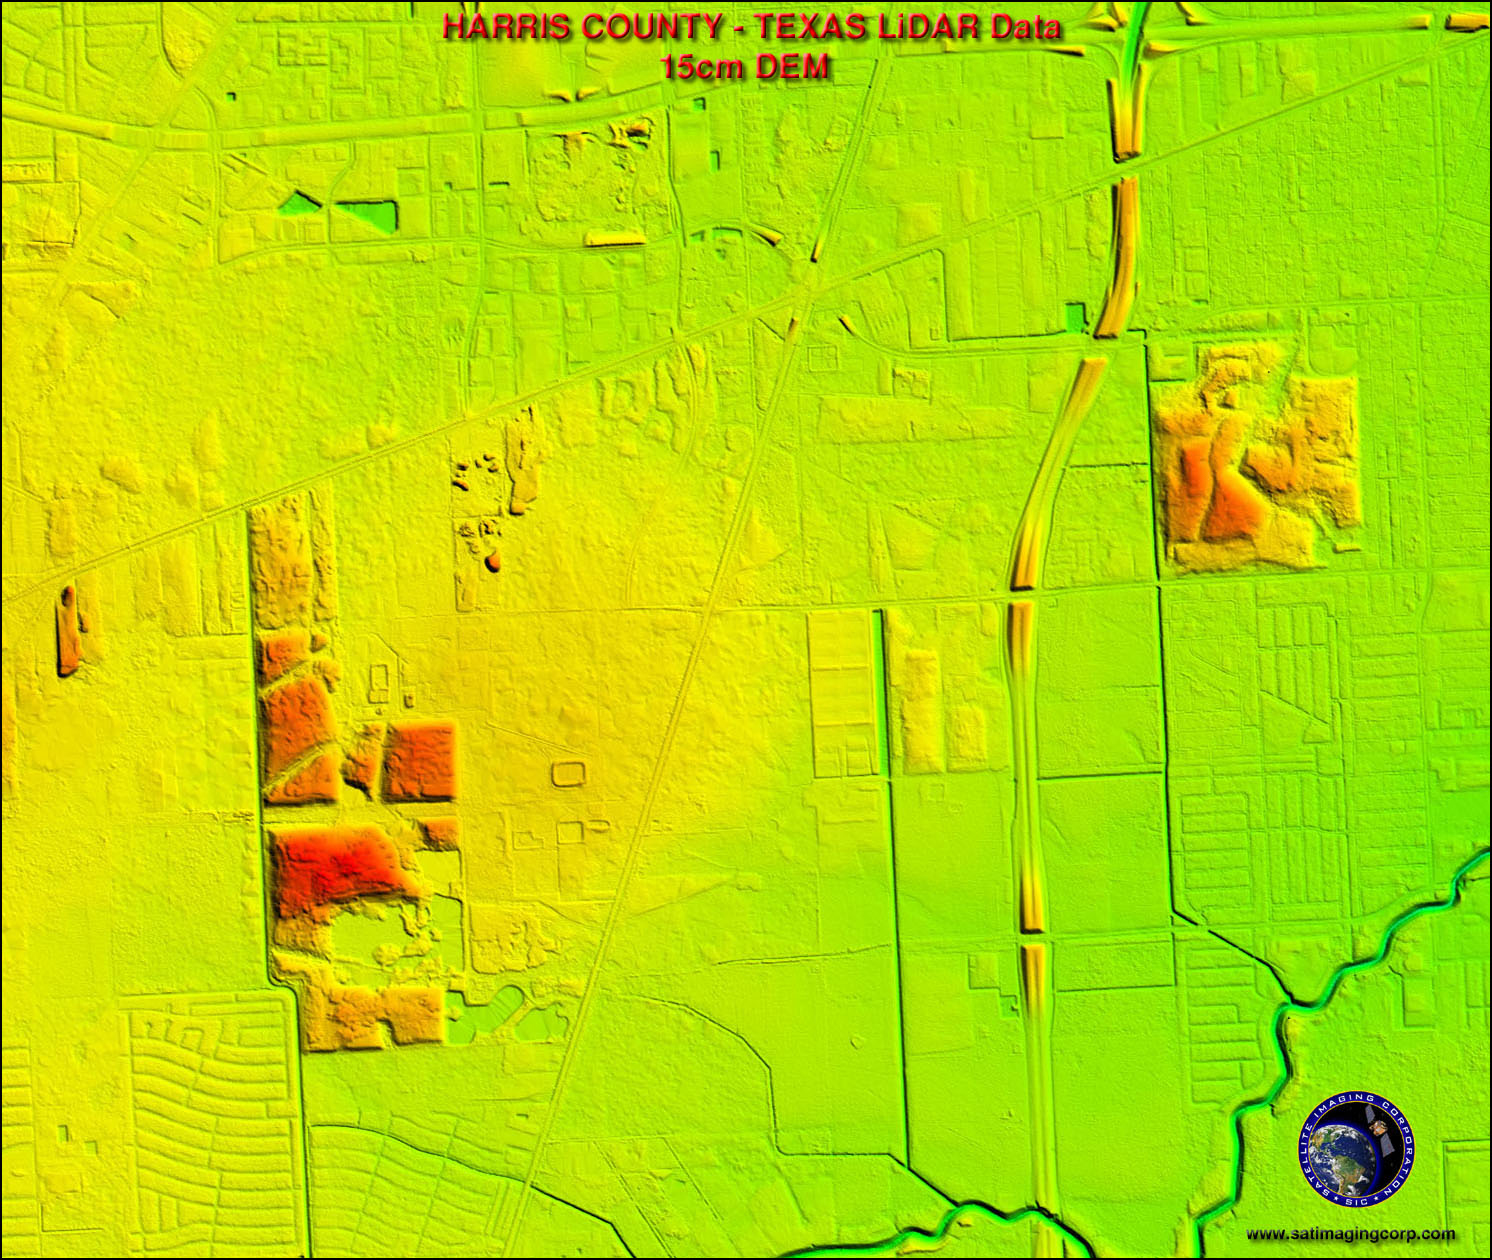
LIDAR, light detecting and ranging, is a remote sensing technique. It works by bouncing light off an object and then measures the time between transmissions to create a 3D model.


Isotachs

Isotachs are found on weather maps their purpose is to show different wind speeds.When the wind lines are closest together the wind speed is strongest. This example is from Mexica and the southwest US.
isohyet

An isohyet is a line joining points of equal precipitation on a map this type of map is called an isohyetal map.
Subscribe to:
Posts (Atom)